INSIDE THE NUMBERS

THEFORMULAS.

Make the inputs visible.
Let the numbers do the talking.

2025–26 MODEL EDITION
A score is a recipe.
These are the ingredients.

Every contender goes through the same calculation for an award. The score combines individual production, efficiency, availability, and relevant team context. Rankings update when the formula or its inputs change.

01

Gather the inputs.

Regular-season statistics from the selected season. Each award uses its own candidate pool.

02

Apply the weights.

The displayed season uses its saved model weights. MVP, DPOY, and ROY standardize inputs before adding them.

03

Rank the scores.

The ten highest scores form our ballot. Scores are specific to an award, and are not winning probabilities.

z(x) = (x − mean) / standard deviation

Think of z(x) as a common ruler. A score of +1 means that input is one standard deviation above the candidate average. Rebounds and shooting efficiency can then be combined without their different units dominating the result.

MVP

Most Valuable Player

Production, efficiency, availability, and team performance. Twelve inputs. One score.

THE EQUATION
Score = Σ weight × z(stat)

Each input is measured against this season’s candidate pool. Multiply each standardized input by its weight, then add the results. Higher scores rank first.
582 CANDIDATES12 INPUTS2025–26 WEIGHTS
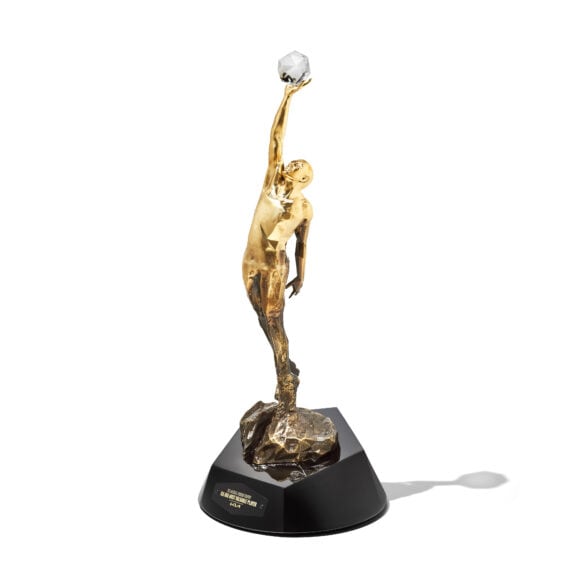
Michael Jordan TrophyMichael Jordan Trophy

InputWeightRelative coefficient magnitude
Points per gamepts_per_game+1.5823
Rebounds per gametrb_per_game+0.7371
Assists per gameast_per_game+0.8840
Steals per gamestl_per_game+0.1680
Blocks per gameblk_per_game+0.1001
Turnovers per gametov_per_game-0.0100
True shootingtrue_shooting+0.5558
Minutes per gamemp_per_game+0.0477
Games / team gamesavailability+0.5604
Team wins per 82 gameswins82+1.3631
Team offense vs. leaguerelative_offense+0.4481
Team defense vs. leaguerelative_defense+0.8387

Weights are shown to four decimal places. Rankings use full precision from the downloadable model data.

MVP v3 · AWARD RANKINGSee the top ten
DPOY

Defensive Player of the Year

Defensive activity, team defense, and time on the floor. The other side of the game.

THE EQUATION
Score = Σ weight × z(stat)

Each input is measured against this season’s candidate pool. Multiply each standardized input by its weight, then add the results. Higher scores rank first.

582 CANDIDATES12 INPUTS2025–26 WEIGHTS
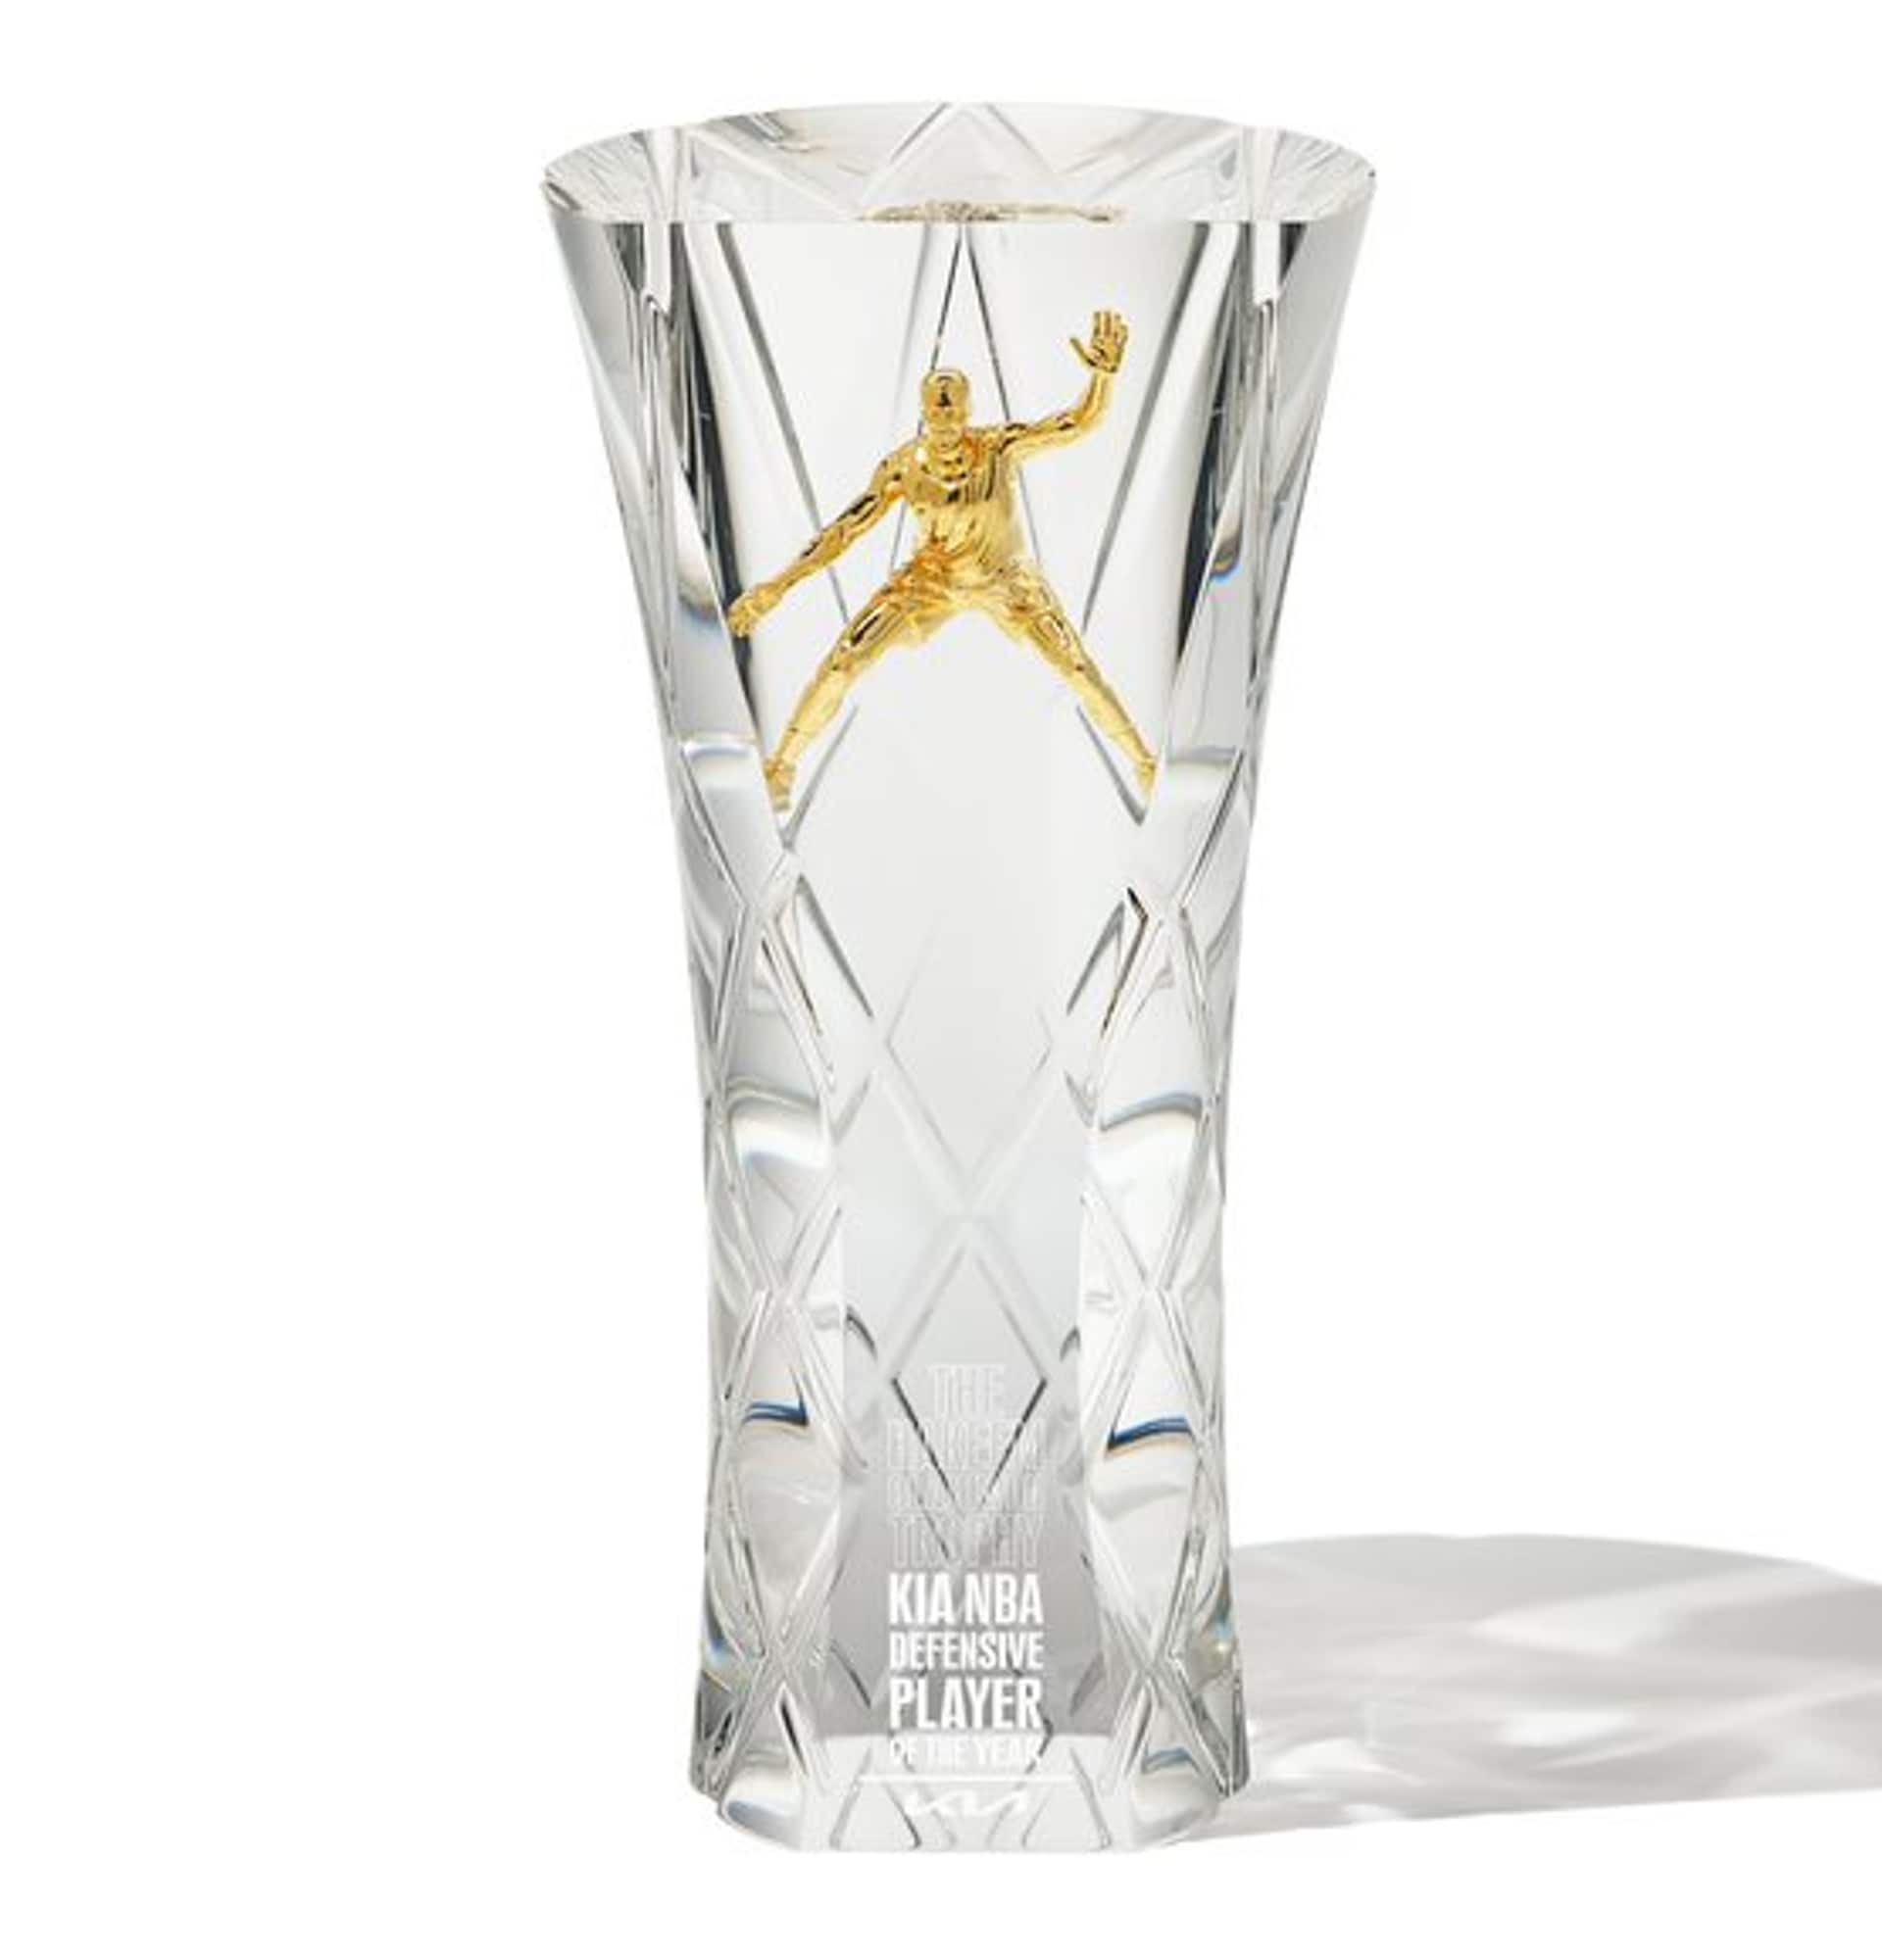
Hakeem Olajuwon TrophyHakeem Olajuwon Trophy

DPOY v2 · AWARD RANKINGSee the top ten
ROY

Rookie of the Year

The first-year class, measured by production, efficiency, and impact.

THE EQUATION
Score = Σ weight × z(stat)

Each input is measured against this season’s candidate pool. Multiply each standardized input by its weight, then add the results. Higher scores rank first.

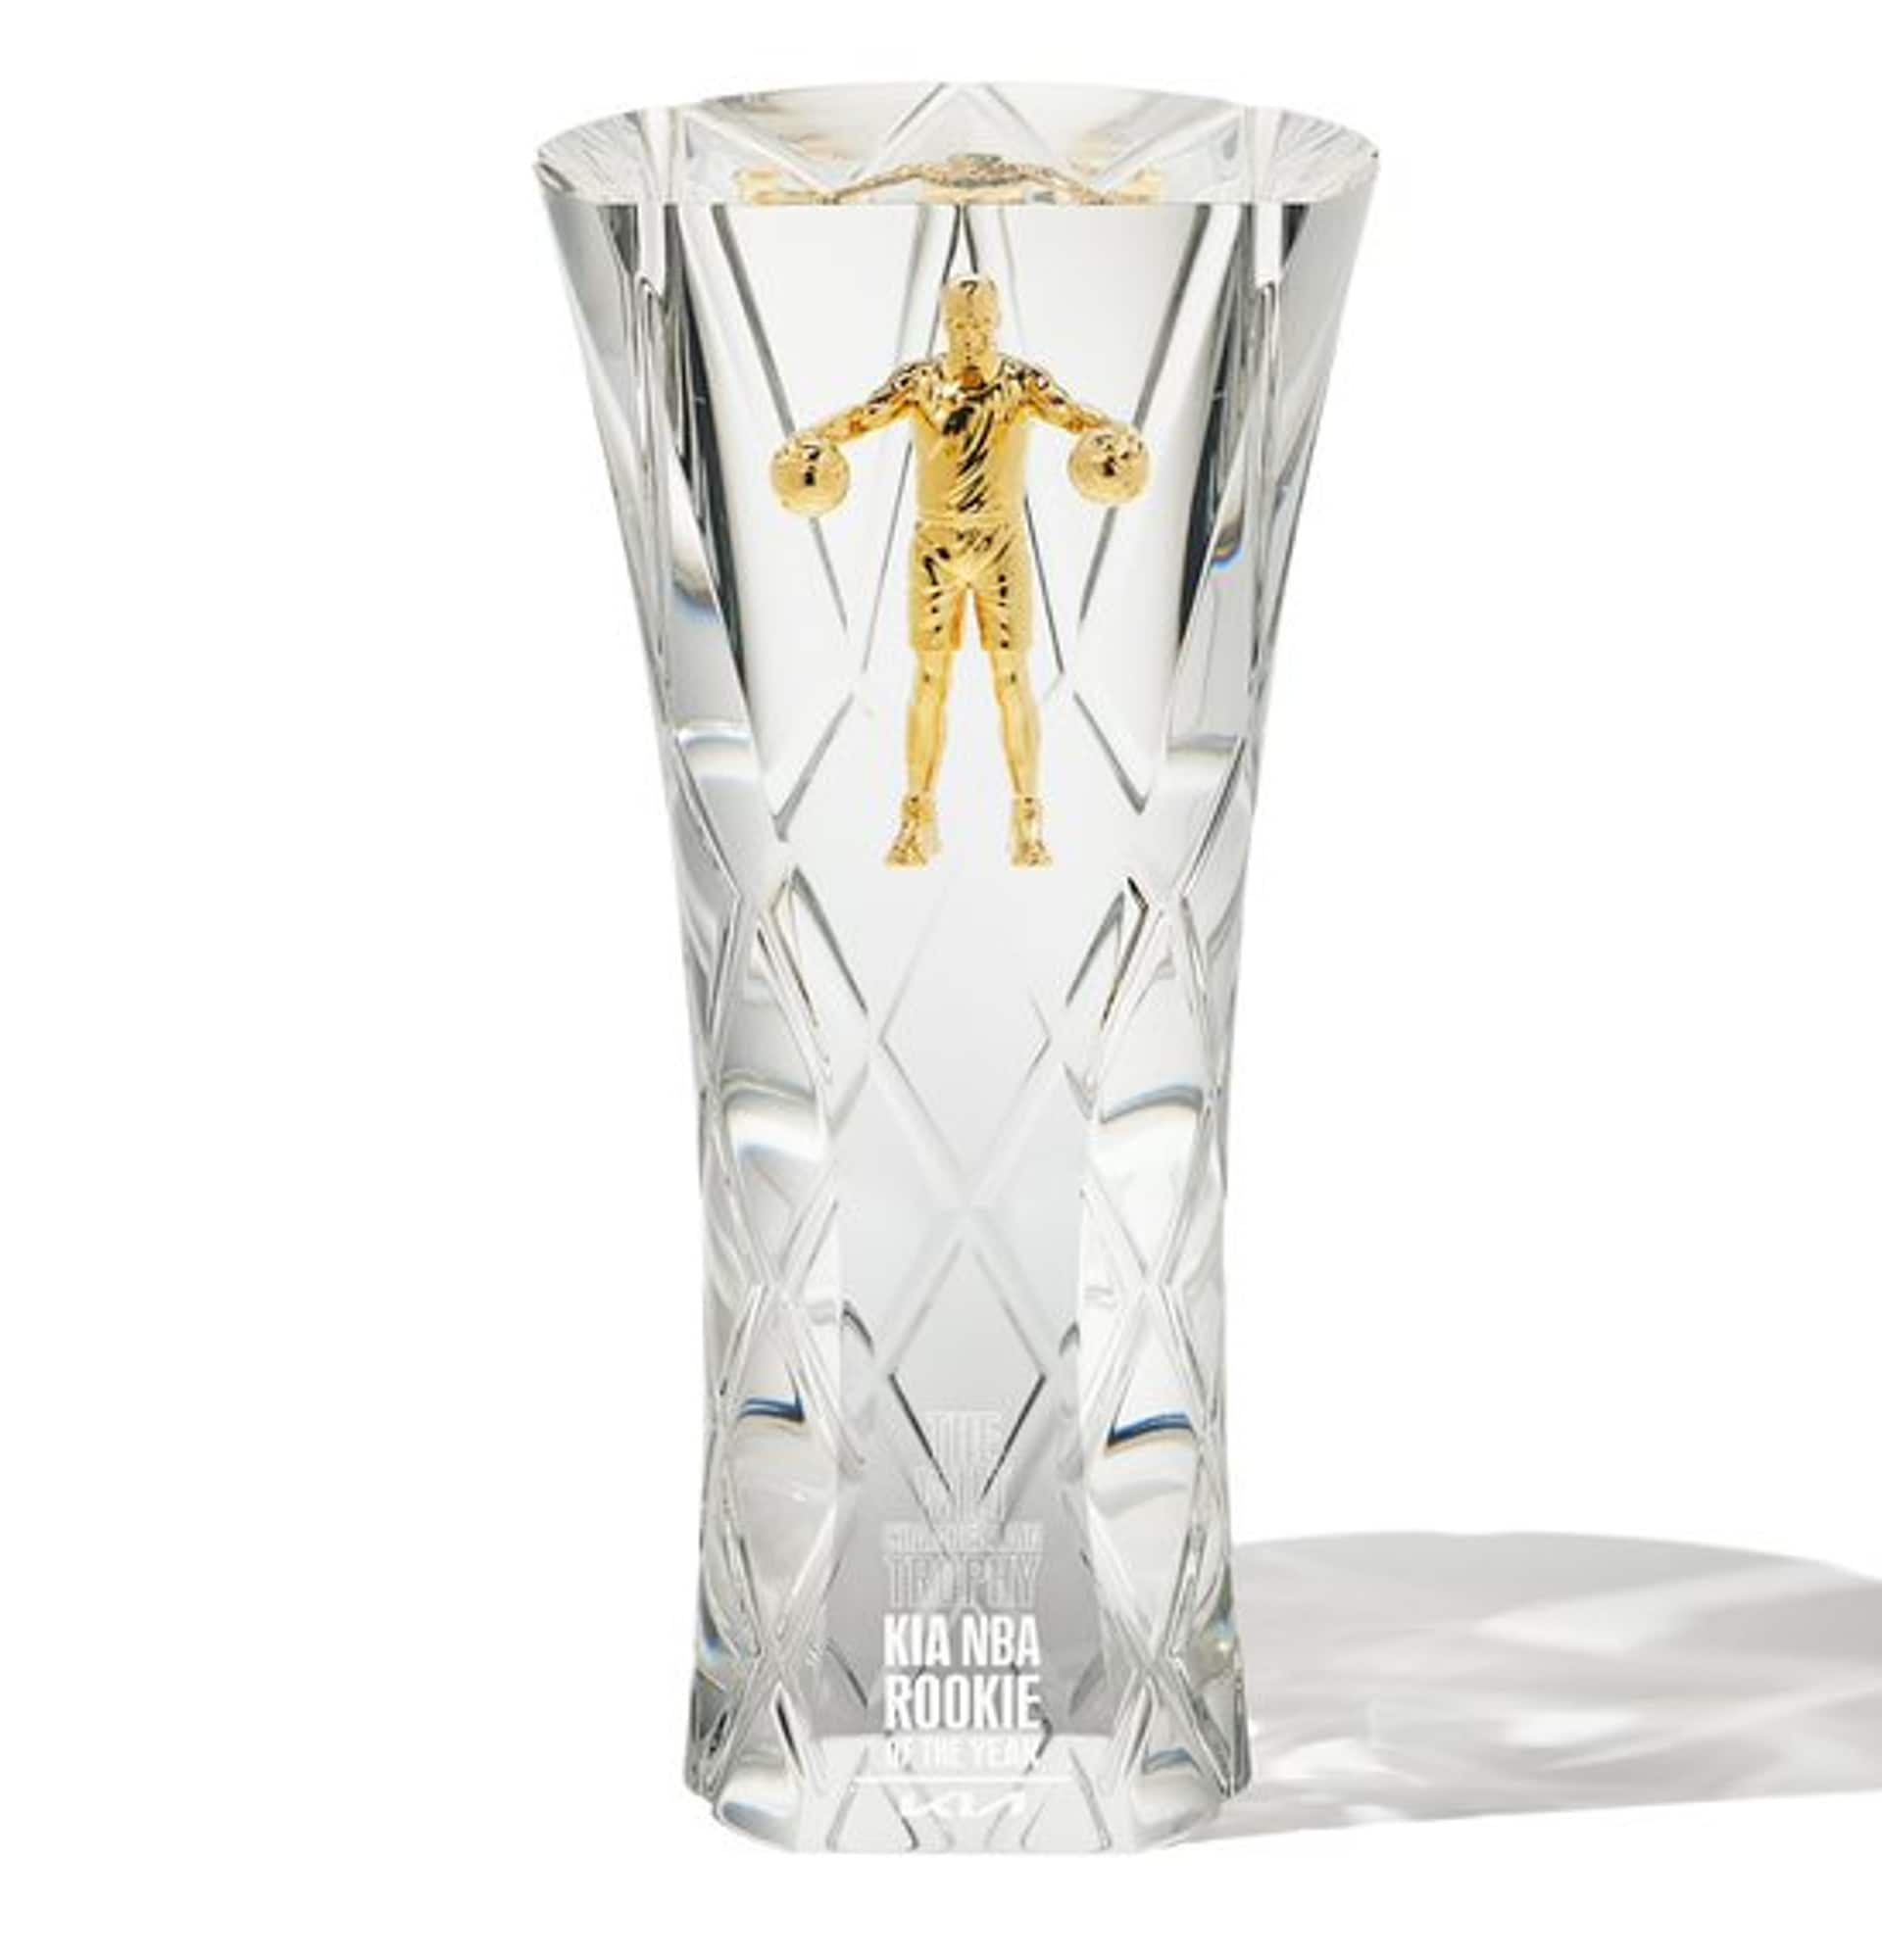
103 CANDIDATES12 INPUTS2025–26 WEIGHTS
Wilt Chamberlain TrophyWilt Chamberlain Trophy

ROY v2 · AWARD RANKINGSee the top ten
COY

Coach of the Year

Team performance and year-over-year change, from the sideline.

THE EQUATION
Score = Σ weight × input

Multiply each input by its saved weight, then add all terms. Inputs include direct statistics and, where specified, within-season percentiles. Higher scores rank first.

32 CANDIDATES26 INPUTS2025–26 WEIGHTS
Red Auerbach TrophyRed Auerbach Trophy

COY · AWARD RANKINGSee the top ten
MIP

Most Improved Player

The biggest leaps. Current production meets individual improvement.

THE EQUATION
Score = Σ weight × input

Multiply each input by its saved weight, then add all terms. Inputs include direct statistics and, where specified, within-season percentiles. Higher scores rank first.

479 CANDIDATES37 INPUTS2025–26 WEIGHTS
George Mikan TrophyGeorge Mikan Trophy

MIP · AWARD RANKINGSee the top ten
6MOY

Sixth Man of the Year

Starting on the bench. Changing the game. The model ranks the reserve rotation.

THE EQUATION
Score = Σ weight × input

Multiply each input by its saved weight, then add all terms. Inputs include direct statistics and, where specified, within-season percentiles. Higher scores rank first.

385 CANDIDATES14 INPUTS2025–26 WEIGHTS
John Havlicek TrophyJohn Havlicek Trophy

6MOY · AWARD RANKINGSee the top ten
CPOY

Clutch Player of the Year

When the margin is five or fewer, and the clock is under five. Every basket counts.

THE EQUATION
Score = Σ weight × input

The score counts made field goals in clutch situations. Highest total ranks first. Equal totals share the same rank.

492 CANDIDATES1 INPUT2025–26 WEIGHTS
Jerry West TrophyJerry West Trophy

CPOY · AWARD RANKINGSee the top ten

READING THE MODEL

OPEN THE NOTEBOOK

The exact numbers. Yours to explore.

DOWNLOAD MODEL DATA